

Melrose, Massachusetts, recorded more single-family home sales during the first nine months of 2026 than during the same period in 2025, while the median sale price declined, according to MLS Property Information Network, Inc. (MLS PIN).
Meanwhile, condominium inventory on Sept. 30 was more than double the same day the year before.
Melrose remained a competitive market for homebuyers, especially for single-family homes.
Melrose Single-family Sales Up, Prices Slip
From January through September 2026, 156 single-family homes sold, up 11 percent from 140 during the same nine months in 2025. Sales totaled 182 in 2022, 129 in 2023, and 131 in 2024. The 2026 total was the second highest in the five-year comparison and 14 percent below 2022.
The median single-family sale price through September 2026 reached $977,500, down 2 percent from $997,500 in 2025. Earlier medians for the same nine-month period were $827,500 in 2022, $875,000 in 2023, and $870,000 in 2024. Despite the latest annual decline, the 2026 median was $150,000, or 18 percent above 2022.
The median sale price as a percentage of original list price measured 105.94 percent through September 2026, compared to 108.53 percent in 2025. The corresponding figures were 107.02 percent in 2022, 105 percent in 2023, and 106.02 percent in 2024. The numbers are clear. Homebuyers face strong competition in the Melrose single-family home market.
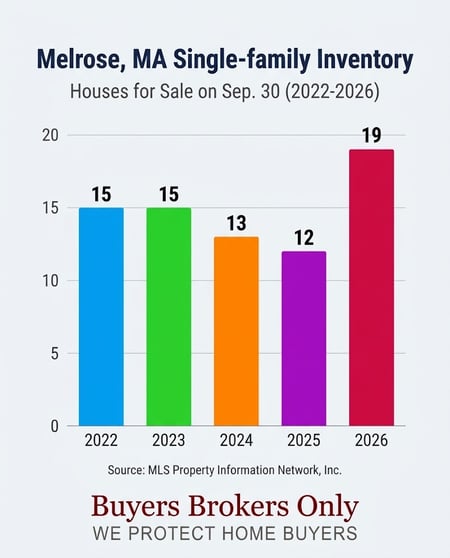 On Sept. 30, 2026, Melrose had 19 single-family homes listed for sale, the highest count in five years. Inventory increased 58 percent from 12 homes in 2025 and 27 percent from 15 in 2022. On Sept. 30, there were also 15 listings in 2023 and 13 in 2024.
Approximate months’ supply of inventory reached 1.15 months on September 30, 2026, compared with 0.78 months in 2025. Supply on the same date measured 0.71 months in 2022, 1.10 months in 2023, and 0.89 months in 2024.
While single-family inventory has risen a bit throughout Greater Boston, Melrose’s supply remains extremely tight. During the 12 months ending September 30, 2026, 38 single-family listings had price changes, up 36 percent from 28 during the preceding 12 months. Comparable totals were 38 in both 2022 and 2023, and 22 in 2024. The report identifies price changes without specifying direction, but most were price drops.
Single-family sales during those 12-month periods totaled 254 in 2022, 164 in 2023, 176 in 2024, 184 in 2025, and 198 in 2026. The latest total increased 8 percent from the period ending Sept. 30, 2025, but remained 22 percent below the period ending Sept. 30, 2022.
Condo Sales Decline as Inventory More Than Doubles
Melrose recorded 50 condominium sales from January through September 2026, down 12 percent from 57 during the same period in 2025. Sales totaled 67 in 2022, 49 in 2023, and 46 in 2024. The 2026 total was 25 percent below 2022.
The median condo price through September 2026 increased to $532,500, up about 1 percent from $524,900 in 2025. The median was $495,000 in 2022, $475,000 in 2023, and $600,000 in 2024. The 2026 figure stood nearly 8 percent above 2022 but 11 percent below the 2024 peak.
The median sale price as a percentage of original list price averaged 100 percent during the first nine months of both 2025 and 2026. It measured 100.91 percent in 2022, 100 percent in 2023, and 100.88 percent in 2024.
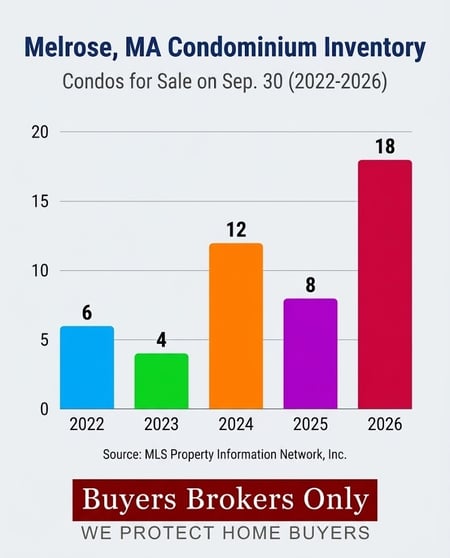 Condominium inventory reached 18 listings on September 30, 2026, up 125 percent from eight on the same date in 2025. The latest count was triple the six listings in 2022 and the highest over five years. Inventory totaled four units in 2023 and 12 in 2024.
Approximate months’ supply rose to 3.22 months on September 30, 2026, from 1.22 months in 2025. Earlier readings on that date were 0.90 months in 2022, 0.73 months in 2023, and 2.15 months in 2024.
During the 12 months ending September 30, 2026, 25 condominium listings had price changes, up 19 percent from 21 during the preceding 12 months. Comparable totals were 18 in 2022, 15 in 2023, and 13 in 2024.
Condominium sales during those 12-month periods totaled 80 in 2022, 66 in 2023, 67 in 2024, 79 in 2025, and 67 in 2026. The latest total declined 15 percent from the period ending September 30, 2025, and 16 percent from the period ending September 30, 2022.
What Melrose Homebuyers Need to Know
For many homebuyers, the easiest path to homeownership in highly competitive Melrose is through the condominium market. Homebuyers have, on average, paid about 100 percent of the original list price over the past five years, but more units were available to choose from on Sept. 30.
As for single-family homes, supply is up, but only from about three weeks to four weeks. About five months of inventory is considered a balanced market between homebuyers and sellers. That tight inventory has led homebuyers to pay about 6 percent over the listing price on average through September.